I’m excited to be one of three Technical Program Committee Co-Chairs for ACM e-Energy 2022 — together with Adam Wierman from CalTech and Li Na from Harvard.
I’ve been involved with e-Energy as a reviewer and member of the TPC since 2017. For me, this is the best energy-focussed conference at the intersection of the computer science and engineering communities. The review process is always rigorous but fair, and over the years I’ve been lucky to work with and learn from so many knowledgeable reviewers. We are putting together a similarly excellent technical program committee again this year.
Please consider submitting your paper to this high-quality conference — see the Call for Papers for more details.
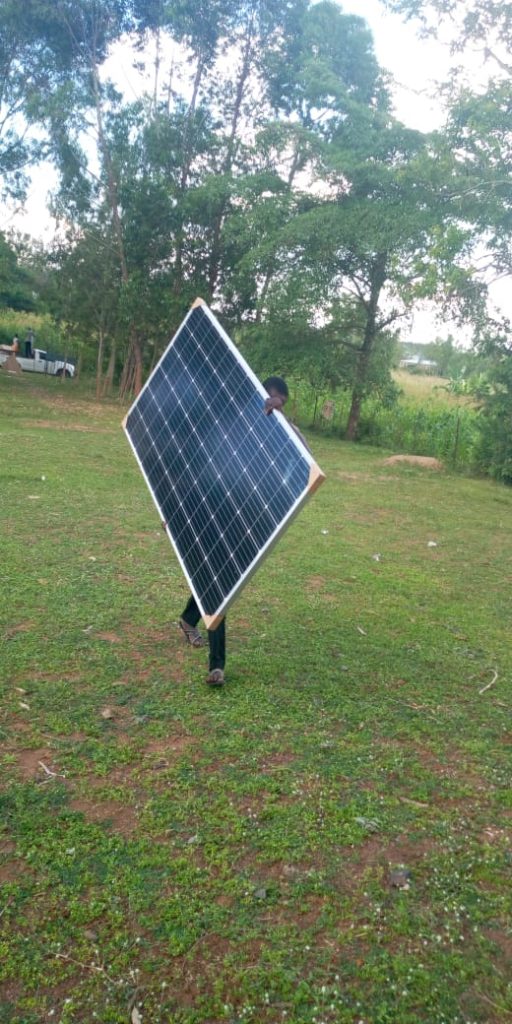
Between January-June 2021, I worked together with an Australian NGO, Positive Aid, to help them select and install solar panels and a battery in their headquarters in Uranga, a remote part of Kenya that is not connected to the grid. It was a fantastic experience and there is so much potential for this system to help the local community in many different ways. I thought I would share what I learnt, what worked well, and what to look out for – in case anyone in a similar situation stumbles across this blog.
A bit of background
Positive Aid is an Australian NGO founded and run by our neighbour, Jess Alvarez, based in Melbourne. They do amazing work in three key areas: health literacy, HIV/AIDS outreach, and Maternal Child and Newborn Health. In twelve years of operation, Positive Aid has helped tens of thousands of people receive access to healthcare and health education, whilst only incurring overheads of around 6%. If you look at their website and social media posts, you’ll quickly learn that this is an organisation that believes in fundamental, lasting change, driven by local, grassroots involvement. My wife Keira and I were inspired as we gradually learned more about the work being carried out, and we have now been supporters for many years (with Keira even joining the Positive Aid board).
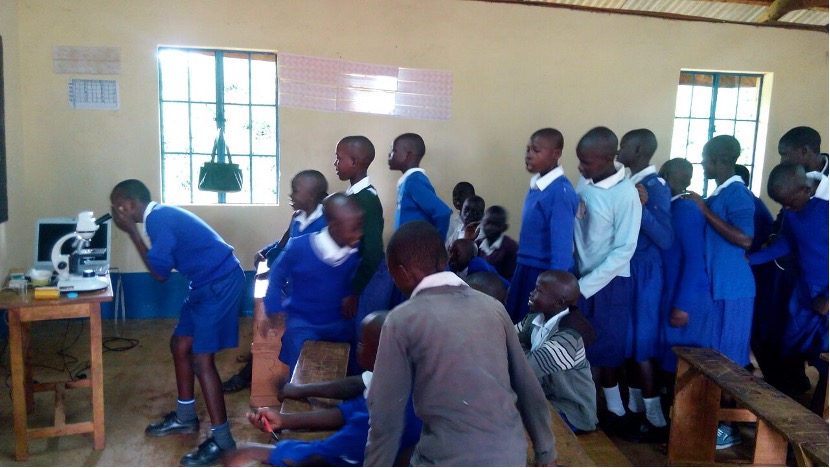
Children learning about germs and safe water as part of a Positive Aid health literacy outreach program
In 2020, whilst I was still at IBM Research Australia, IBM ANZ made funding available for projects connected to organisations that employees volunteered with or contributed to. We knew that Positive Aid and its workers did not have access to ongoing electrical power, which made it difficult to conduct effective monitoring and reporting, and which limited the range and effectiveness of their health literacy activities. This included the use of microscopes to teach local people about germs, safe water, and most urgently, COVID-19 – lifesaving matters in poor rural villages. It seemed like this call for funding was an ideal opportunity to use our expertise at IBM to help them look into the use of a solar PV + battery system, in order to overcome these challenges. We applied for funding, and we were successful.
The role of our supporting team at IBM was to help Positive Aid navigate the process of understanding what sort of system specs and components they needed (panels, battery, inverter) and to help them determine how to source and install these. We jumped straight into the task!
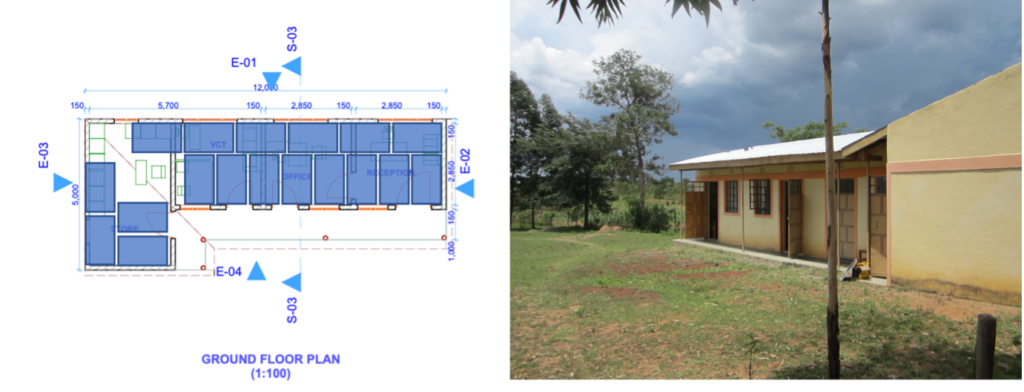
Site floor plan (with possible panel locations overlaid), and picture of site
Understanding solar generation potential
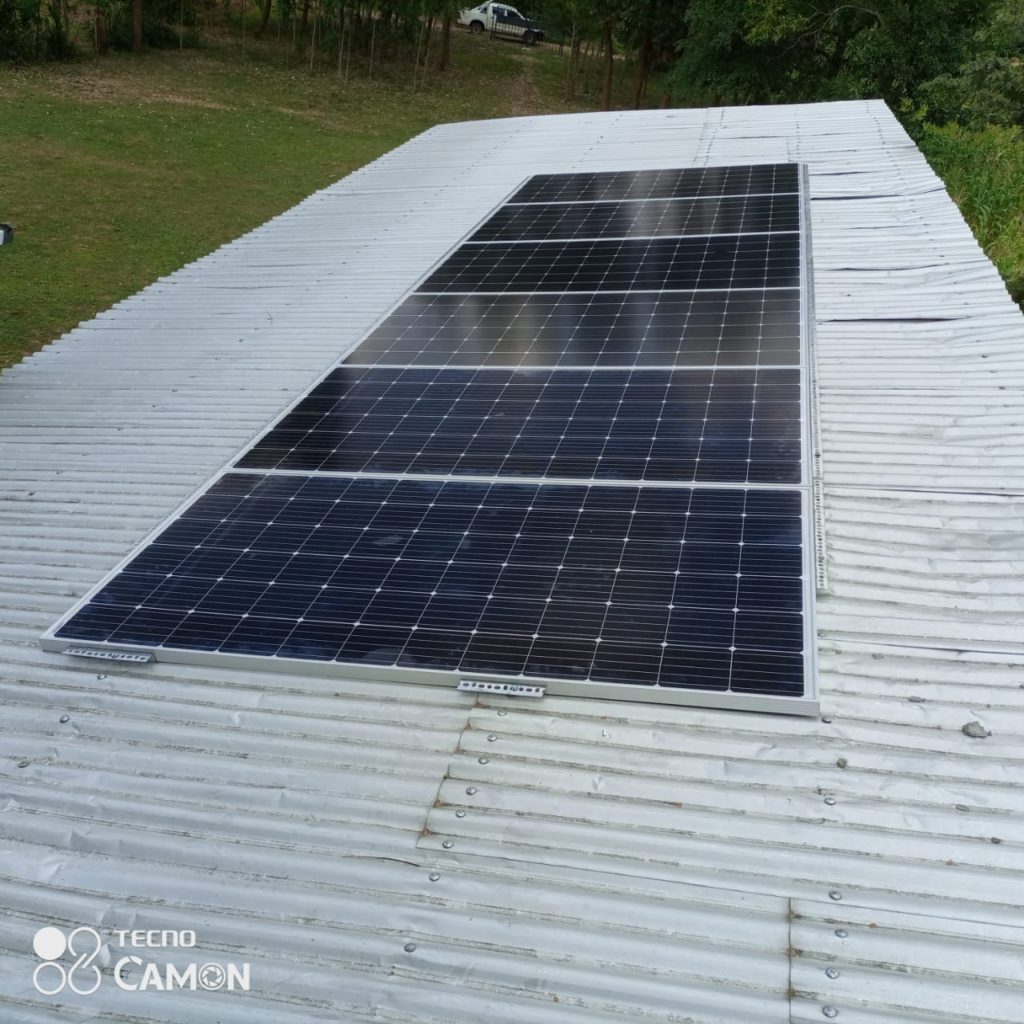
First, we evaluated the site to understand its solar generation potential. The “headquarters” is a small, simple structure built from local materials, with a sheet metal roof. Jess provided photos and even had a site plan from when it was first built. We were able to determine the dimensions of the roof, and to estimate how many panels could be fitted on, using standard panel sizes as an initial estimate. It turned out that there would likely be enough space for up to 18 panels on the roof. Conservatively assuming a per-panel capacity of 260W (which is low these days), this meant that the site had potential rooftop space for a total capacity of close to 5kW, which (as we already guessed) was far more than would be needed. In principle we could have explored the potential for additional panels on other structures, or even on some ground-based mounting system – but in the end this wasn’t necessary.
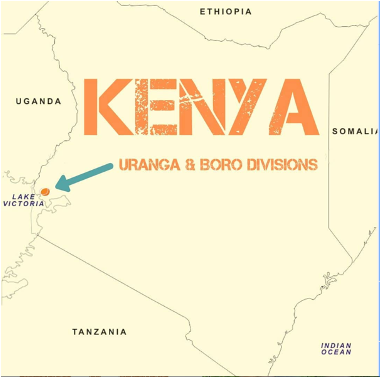
The site is located in Uranga, near the border to Uganda
The next step was to estimate solar insolation for the site, to determine (i) how much solar we could expect to generate, (ii) what the seasonal differences would be from one time of the year to the next, and (iii) whether we needed to be aware of extended periods of cloudiness (which for solar + battery systems can impact the choice of battery size). The site is located in Uranga, a remote part of western Kenya, close to the border with Uganda. Following an online search, we identified a couple of really helpful tools:
Both gave fairly similar data estimates when we compared them. A big, big thank you to the people who make these handy tools available!
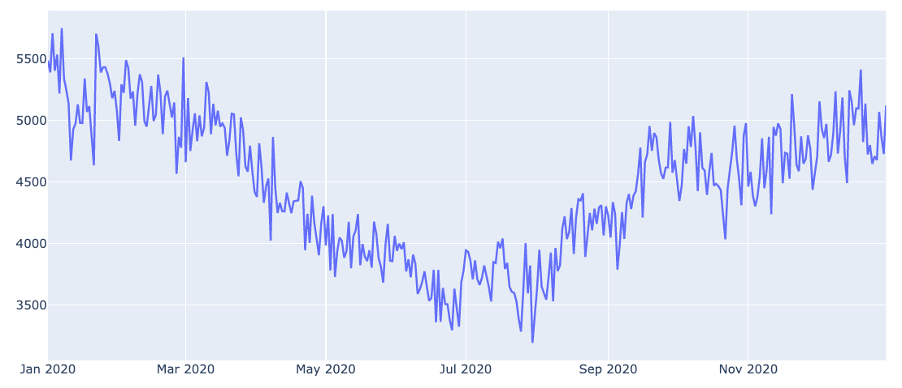
Average daily solar irradiation for a 1kWp solar PV system for a full year (averaged over 2010-2016 – ignore “2020” in the x-axis labels)
These tools allowed us to generate and inspect several years of solar insolation data for that specific location, and even to estimate actual power output of a solar PV system. Whilst there were obviously seasonal differences, there did not seem to be a significant risk of extended periods of time without at least a little bit of sunshine. In other words, there was no particular need to oversize the battery.More specifically, we found that a 1kW (approximately 4 panels) solar PV system would generate, on average, between 3.5 and 5.5 kWh per day.
Understanding energy demand
That sorted the generation, but what about the demand? How much energy did Positive Aid need at the site? How much energy would they be needing for their future activities? This was a slightly more difficult question to answer, and I needed a lot of help from Jess and Alice Mitchell, the Vice President of Positive Aid, and midwife/ PhD in public health, to better understand this.
The majority of Positive Aid’s requirements are really only very small – charging a laptop, charging a mobile phone, running a monitor to show the outputs of a microscope, running lights after sunset. However, Jess has ambitions for the site to become more than just an office, and dreams of one day running a health centre or even a birthing clinic there. Although our project budget likely wouldn’t enable us to support such an endeavour at this stage, we decided to scope out the requirements – just to know what would be needed if this were to be possible in the future. We decided to explore what the daily energy requirements of four different scenarios would be: (i) existing requirements; (ii) existing requirements plus additional income generating activities; (iii) a health centre; and (iv) a birthing centre.
I sat down with Jess and Alice and learned about many health-related appliances that I had never heard of before. A health centre would need an autoclave and a hemocue, radiant heaters and an IV pump, among many other essentials. We managed to broadly approximate both what the instantaneous power requirements would be, and what the energy demand across a 24-hour period might be.
I won’t include the full analysis here, but in short, the simplest scenario (existing requirements) only required about 400Wh per day, while the most complex (birth centre) required at minimum 10.5kWh per day.
To understand how such a daily demand figure can be converted into a solar PV system size, we needed to know the capacity factor for solar PV in Kenya – in other words, how much a given system may generate over the course of a day, based on its peak generating capacity. This can depend on system tilt, orientation, and many other factors, but we used 0.15 and considered this to be a reasonably conservative estimate.
We also wanted to understand the expected cost of each scenario, so we needed some estimate of the approximate cost per installed Watt. In Kenya, this is still significantly higher than other countries where the scale and speed of installation has brought costs down. We were advised by a local contact based in the solar industry in Kenya that somewhere in the range of US$4.00 to US$4.50 per Watt was to be expected.
In short, our expected minimum system costs ended up as per the table below. Based on our budget and project expectations, we decided to target Scenario 2: existing requirements plus additional income generating activities. This meant we needed a system with a generating capacity of at least 1kW (which is only 4 panels), and a battery of at least 1kWh. For those of us living in Australia, that is a tiny system! But for the modest energy requirements of an office in remote Kenya, this amount of energy provision, including after sunset (due to battery), is a massive help that can make a big difference for many people.
Scenario
Minimum installed cost (US $)
1. Existing requirements
3000
2. Existing requirements – plus additional income generating activiites
4500
3. Future usage – Health Centre
12,200
4. Future usage – Birth Centre
13,100
Finding an installer
The state of the solar PV industry in Kenya is fascinating, with many different players at different ends of the spectrum. Large scale solar is starting to gather momentum, but perhaps there has been even more progress at the very small-scale end-user level. There is a great article by Mark Hankins that delves deep into this history and explains the dynamics at play – definitely worth a read!
In the end we obtained quotes from five different installers – some that we identified directly on the internet, and others that were recommended by friends or colleagues. Whilst there was a significant variability across all of the quotes, they were broadly in line with the quality of the components included in each quote. In other words, some installers gave a quote that was easily within our budget, but used brands of inverters and batteries for which we were not convinced of the component quality; others provided quotes way beyond our budget, but for good reason (since they included top-of-the-line hardware). As always, our final decision was a trade-off between available budget and system requirements – we wanted to be sure that this system would last for more than 10 years, but had to do our best to stay close to our available budget. Even then, for the system that met our minimal requirements we still had to seek some additional support to make up the shortfall. Many of Positive Aid’s supporters and our friends stepped up to the task, and we were incredibly grateful for many generous donations that ultimately brought this project over the line!
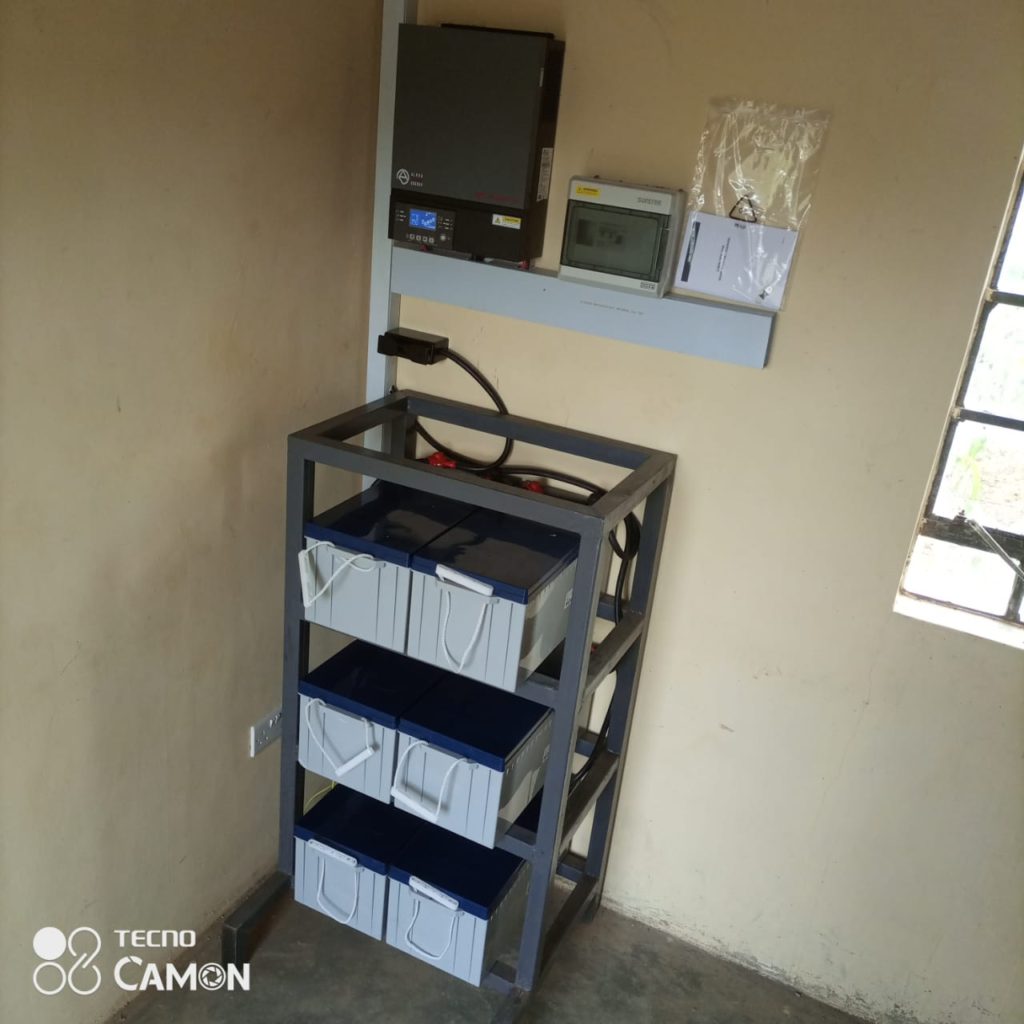
We ultimately settled on a system having 6 panels (Amerisolar, 360W each), 6 lead-acid gel batteries (Ritar, 200Ah each), and a quality inverter (Alpha Outback, 3kVA). The inverter is slightly oversized but this would make the addition of further panels in the future easier (no need to upgrade inverter). In fact, the system as a whole exceeds the needs identified for our Scenario 2, but given that lead-acid batteries last considerably longer when they are under-utilised, this seemed like a sensible decision to ensure system longevity.
Installation, and many benefits, we hope!
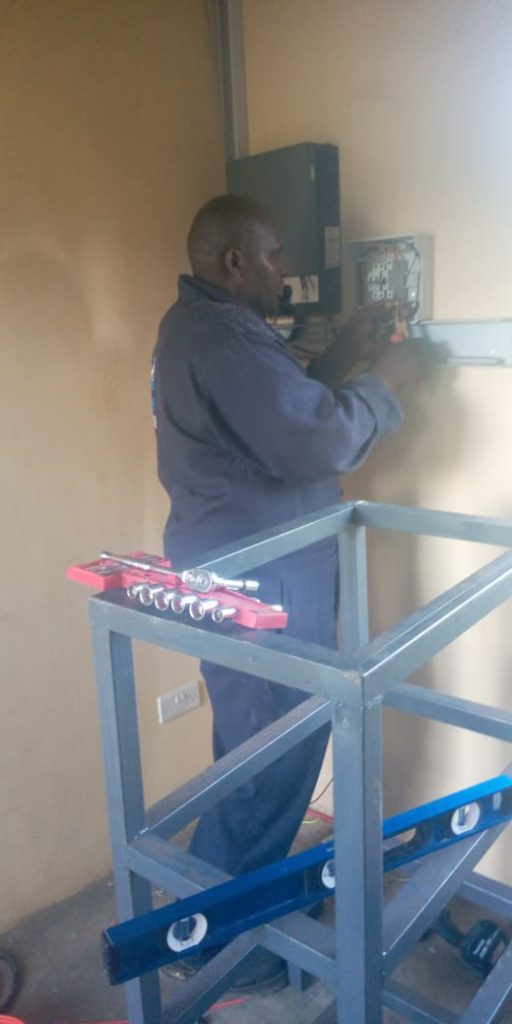
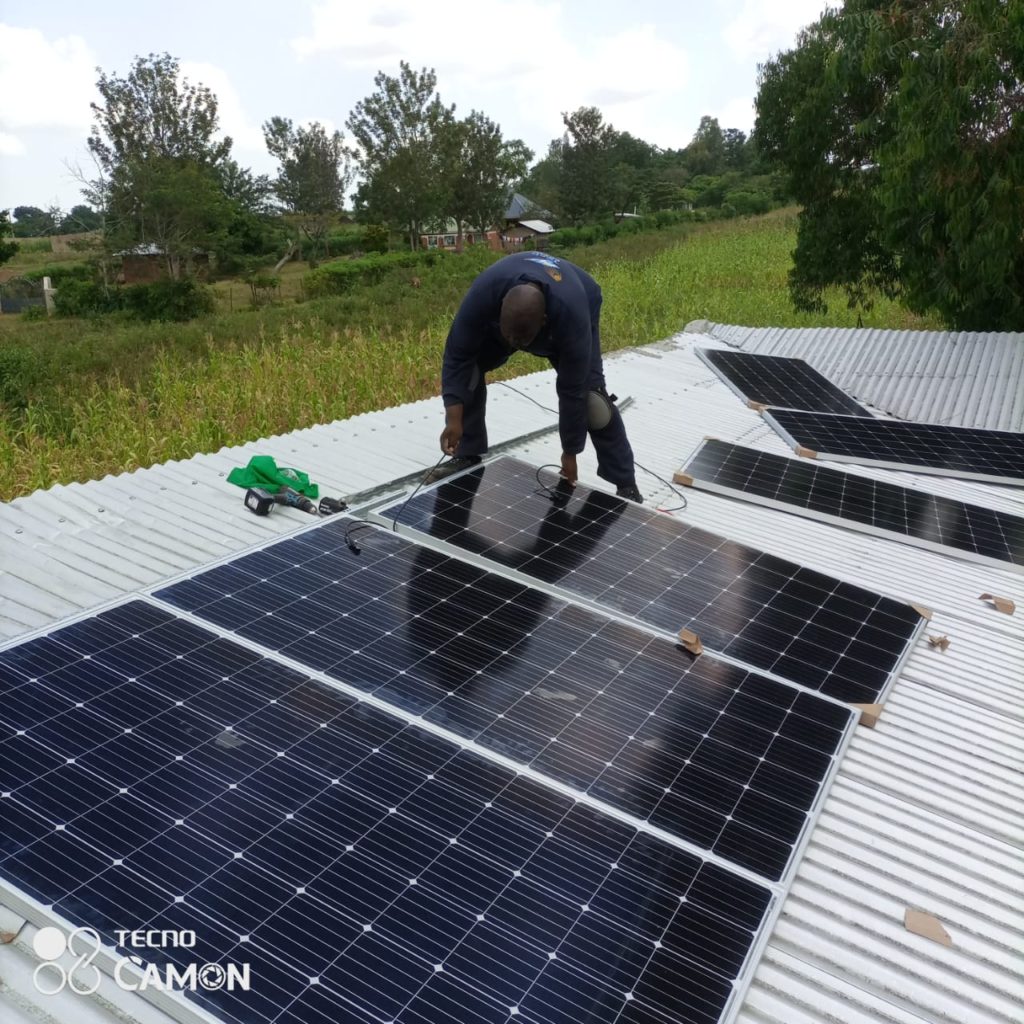
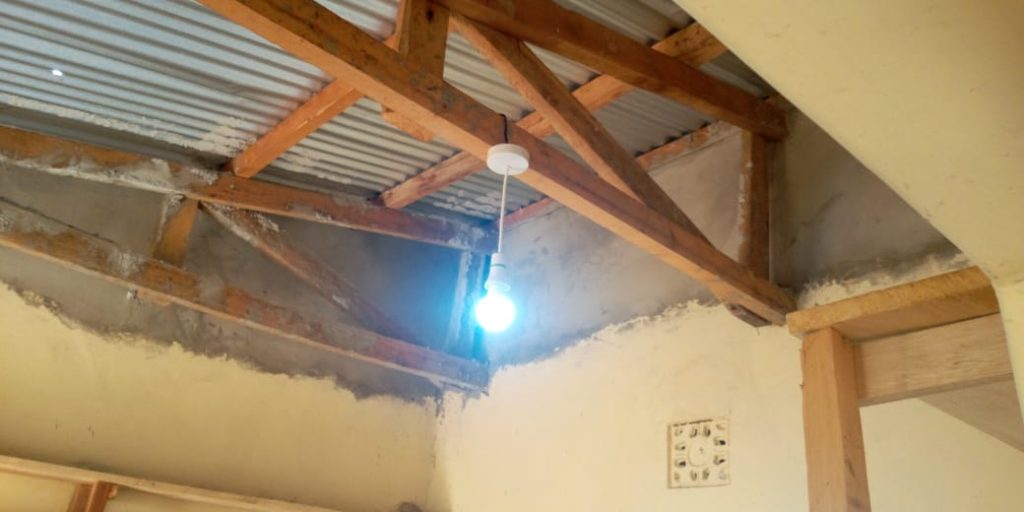
Finally, the exciting installation day arrived. We were thrilled when the first pictures were sent to us, showing the system being put in place. Local staff were excited when the lights were turned on for the first time. The system was up and running!
Light’s on! The solar PV and battery system is up and running
This solar PV + battery system is now powering Positive Aid’s office in Uranga, which is fantastic news. However, we have high hopes that the benefits of this system will far exceed simply powering one site. For one thing, we hope that it will enable modest revenue generating opportunities, such as allowing local villagers to charge their mobile phones or battery packs. These battery packs, in turn, will enable families to power lights, radios, and small electrical devices in their homes, so that school children can study after dark, villagers can connect with current affairs, and people can benefit from some of the most simple electronic appliances we tend to take for granted in many other parts of the world. In addition, we hope that the availability of electrical power will further turn the headquarters into a more active local hub, where villagers meet Positive Aid staff and have an opportunity to receive health literacy education. Finally, we hope that this system provides a positive local example of the benefits and value of distributed off-grid solar PV and storage – powered by clean, green, renewable energy, and providing energy independence. As the local team starts to understand the system and learn to use it, it will be fascinating to see how many of these opportunities are realised.
Thank you
This project would never have been possible without the generous support of IBM ANZ Australia. We are also incredibly grateful for many further donations from Positive Aid supporters, and our friends and family, that helped secure the necessary shortfall. The impact of this system will be felt throughout the community for many years to come, and all your donations will improve countless lives, and extend Positive Aid’s reach far beyond what has been possible until now. Thank you!
At Positive Aid, Alice Mitchell provided invaluable advice on energy requirements, Keira de Hoog did an amazing job of helping to promote the project and drive the fundraisers we needed to get the project over the line, and of course Jess Alvarez has driven the whole project from its inception.
Follow the rest of the journey on social media! And consider becoming a supporter of Positive Aid.
In May, together with several colleagues at the University of Melbourne, I started to explore the idea of whether time series data from individual sites could be combined with geospatial data for better regional solar PV forecasts. We submitted a short (proposal) paper to a very interesting workshop at ICML, one of the world’s major machine learning conferences. The workshop (“Tackling Climate Change with Machine Learning“) is run by a very interesting community, Climate Change AI — academics and industry researchers with a common vision for the potential of using AI to help understand and improve problems arising from climate change. I’m pleased to say that our paper was accepted, and I look forward to sharing our ideas and getting more connected to this community.
The title of the paper is “Solar PV Maps for Estimation and Forecasting of Distributed Solar Generation”, and my co-authors on this paper, that I’m very happy to be working with, are Maneesha Perera, Kasun Bandara, Damith Senanayake, and Saman Halgamuge (all from University of Melbourne).
The full details are in the paper,the slides, and the recorded talk, all of which are also available directly on the workshop website. However, I’ll also provide a very short summary of the motivation for why we starting doing this work here.
Solar PV is now the fastest growing form of energy generation in the world. Some of this is large scale (solar farms), but a significant percentage, close to half, is small scale — solar PV systems on the rooftops of peoples homes and businesses. The IEA projects that from 2019 to 2024, this distributed solar PV is set to more than double, to more than 100 million individual systems. Here in Australia, this trend is very noticeable: more than one in five homes in Australia now have solar panels on their roofs.
Renewable, “green” solar energy is of course great news, and this is an encouraging trend. However, all this distributed solar PV can cause significant problems too, and make life much harder for network operators, market operators, and businesses that participate in the energy settling process (i.e. generators and retailers). For example, this great talk by Julius Susanto at AEMO describes in detail what the impacts on distribution networks can be when there is this much solar PV installed.
Many of these issues can be alleviated if we had better forecasts of regional distributed solar PV. In other words, if we could forecast how much all the distributed solar panels in an entire neighbourhood, an entire market region, or even an entire grid may be generating in the next 1-6 hours, many of the short-term problems could be significantly reduced.
There has been a lot of work in this area and there are certainly some promising approaches already. However, even so there is scope for more accurate forecasting, and for estimation of total solar PV across a whole region. One common approach is to use geospatial data, such as weather data or satellite imagery. Intuitively, this makes a lot of sense, since cloud cover is of course the main factor driving solar PV variability. However, satellite imagery can be low-resolution, may have a lag, and may not take certain effects into account that are present on the ground.
On the other hand, we also have increasing amounts of data available from the systems themselves — time series data measured at the system itself, via the inverter or a third party tool such as the monitors provided by Solar Analytics. But this data represents just a single site, and so to combine it with geospatial data, and extend it to a regional forecast that also includes other (non-metered) sites, a different approach is needed.
This is what we tried to start exploring in this paper. Can time series data from individual sites be converted into a 2-dimensional representation of an entire region? In this paper, we have made some first steps towards doing this.
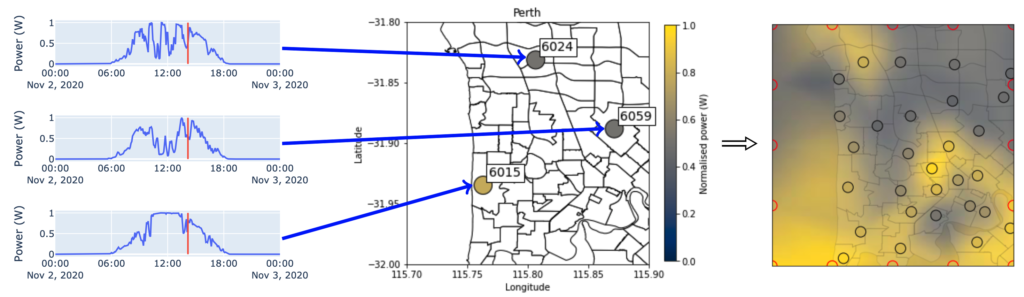
One day’s generation data for three example point sources (solar PV systems) is shown on the left. In any interval – here represented by vertical red lines – power generation values can be represented geo-spatially (middle), in this case using markers at the centers of the postcodes that these three systems are located in. A 2D solar PV map can be generated (right) by fitting a surface to the full set of point sources (markers having black edges) and estimated boundary conditions (markers having red edges). Although this map appears to resemble cloud cover, it was generated purely from a small set of individual point sources on the ground.
Much work still needs to be done, but we consider the idea promising:
Data collected on the ground can take into account impacts that may not be well represented in satellite or overhead imagery
Our approach (fitting a cubic surface to the values for each location that is generating data) allows us to generate “solar maps” for a region at an arbitrary resolution of our choice
Having such 2D representations means that we can leverage successful techniques from Computer Vision and Deep Learning for forecasting — an initial forecasting attempt using a convolutional neural network already looks promising
With these solar maps, we may be able to super-resolve satellite imagery, which may be useful for other applications as well.
It is work in progress, but we look forward to exploring these ideas further. Any comments or suggestions are always welcome, please don’t hesitate to Contact me. Thanks 🙂
In November 2020, myself and a team of my colleagues at IBM Research Australia (Ramachandra Kolluri, Arun Vishwanath, Josh Andres, Peter Ilfrich, Fatemeh Jalali, Iven Mareels) received IBM ANZ Blue for Good funding to help an Australian not-for-profit organisation, Positive Aid, expand its capacity to improve health literacy and provide health services in remote communities in Kenya. The project, entitled “Project Empower”, is helping Positive Aid source and install a solar+battery system for their headquarters in Uranga, in remote Kenya.
In twelve years of operation, Positive Aid has helped tens of thousands of people receive access to healthcare and health education, while incurring an overhead of only 6%. For Positive Aid to now expand its operations, a solution for remote electricity provision is necessary. Positive Aid and its workers do not have access to ongoing electrical power, which makes it difficult to conduct effective monitoring and reporting, and limits the range and effectiveness of health literacy outreach activities — such as the use of microscopes to teach local people about germs, safe water, and most urgently, COVID-19 — life-saving matters in poor rural villages.
Today there are solutions for this, such as solar photovoltaic and energy storage systems, which provide renewable energy without the need for a connection to the grid. Our team at IBM Research Australia had been studying the optimal operation of such systems for years, and assisted Positive Aid to assess their needs, identify suitable products, and arrange a successful installation. The funding is being used for three main activities to enable this project: provision of renewable energy generation and storage; mobile health literacy outreach equipment; and site adaptation costs.
Following an extensive process of collecting quotes and advice from a variety of expert installers and suppliers based in Kenya, we have selected a system that we expect to meet Positive Aid’s energy needs for many years to come. However, solar + storage systems in Kenya (particularly in remote regions) remain expensive, and we were not able to keep system costs below the originally available budget. We now require an extra $2,000 to make this installation happen, so that we can provide ongoing benefits to the communities we support in remote Kenya.
We have set up a GoFundMe page to raise funds. If you are able to help out with this amazing project, it would be so very much appreciated!
I had a bit of fun this week generating a video that shows satellite imagery and solar PV maps side-by-side. This is ongoing research so I can’t say too much about it yet, but this early visualisation is a useful way to explore this problem and think about new ways to solve it.
On the left are images obtained from the Japanese Advanced Himawari Imager. On the right are “solar maps” that we are generating using only time series data from a few point sources (individual solar PV systems). The long term goal is to use this approach, or one like it, to forecast the total distributed solar PV generation of entire regions, like a distribution feeder, or even a market zone. Lots of work to be done still … but the video is fun.