In May, together with several colleagues at the University of Melbourne, I started to explore the idea of whether time series data from individual sites could be combined with geospatial data for better regional solar PV forecasts. We submitted a short (proposal) paper to a very interesting workshop at ICML, one of the world’s major machine learning conferences. The workshop (“Tackling Climate Change with Machine Learning“) is run by a very interesting community, Climate Change AI — academics and industry researchers with a common vision for the potential of using AI to help understand and improve problems arising from climate change. I’m pleased to say that our paper was accepted, and I look forward to sharing our ideas and getting more connected to this community.
The title of the paper is “Solar PV Maps for Estimation and Forecasting of Distributed Solar Generation”, and my co-authors on this paper, that I’m very happy to be working with, are Maneesha Perera, Kasun Bandara, Damith Senanayake, and Saman Halgamuge (all from University of Melbourne).
The full details are in the paper, the slides, and the recorded talk, all of which are also available directly on the workshop website. However, I’ll also provide a very short summary of the motivation for why we starting doing this work here.
Solar PV is now the fastest growing form of energy generation in the world. Some of this is large scale (solar farms), but a significant percentage, close to half, is small scale — solar PV systems on the rooftops of peoples homes and businesses. The IEA projects that from 2019 to 2024, this distributed solar PV is set to more than double, to more than 100 million individual systems. Here in Australia, this trend is very noticeable: more than one in five homes in Australia now have solar panels on their roofs.
Renewable, “green” solar energy is of course great news, and this is an encouraging trend. However, all this distributed solar PV can cause significant problems too, and make life much harder for network operators, market operators, and businesses that participate in the energy settling process (i.e. generators and retailers). For example, this great talk by Julius Susanto at AEMO describes in detail what the impacts on distribution networks can be when there is this much solar PV installed.
Many of these issues can be alleviated if we had better forecasts of regional distributed solar PV. In other words, if we could forecast how much all the distributed solar panels in an entire neighbourhood, an entire market region, or even an entire grid may be generating in the next 1-6 hours, many of the short-term problems could be significantly reduced.
There has been a lot of work in this area and there are certainly some promising approaches already. However, even so there is scope for more accurate forecasting, and for estimation of total solar PV across a whole region. One common approach is to use geospatial data, such as weather data or satellite imagery. Intuitively, this makes a lot of sense, since cloud cover is of course the main factor driving solar PV variability. However, satellite imagery can be low-resolution, may have a lag, and may not take certain effects into account that are present on the ground.
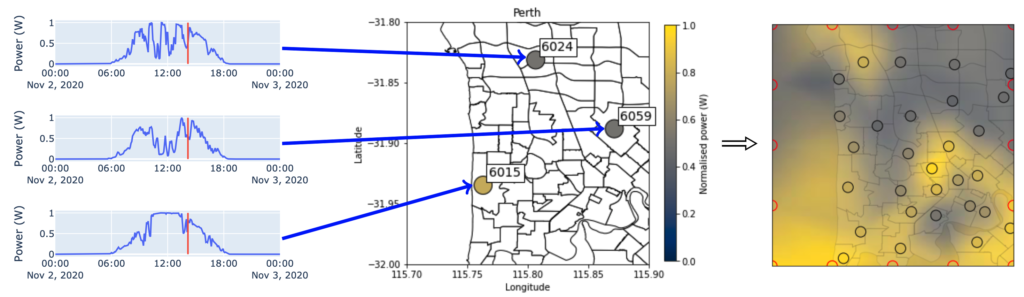
On the other hand, we also have increasing amounts of data available from the systems themselves — time series data measured at the system itself, via the inverter or a third party tool such as the monitors provided by Solar Analytics. But this data represents just a single site, and so to combine it with geospatial data, and extend it to a regional forecast that also includes other (non-metered) sites, a different approach is needed.
This is what we tried to start exploring in this paper. Can time series data from individual sites be converted into a 2-dimensional representation of an entire region? In this paper, we have made some first steps towards doing this.
Much work still needs to be done, but we consider the idea promising:
- Data collected on the ground can take into account impacts that may not be well represented in satellite or overhead imagery
- Our approach (fitting a cubic surface to the values for each location that is generating data) allows us to generate “solar maps” for a region at an arbitrary resolution of our choice
- Having such 2D representations means that we can leverage successful techniques from Computer Vision and Deep Learning for forecasting — an initial forecasting attempt using a convolutional neural network already looks promising
- With these solar maps, we may be able to super-resolve satellite imagery, which may be useful for other applications as well.
It is work in progress, but we look forward to exploring these ideas further. Any comments or suggestions are always welcome, please don’t hesitate to Contact me. Thanks 🙂